How to Turn Energy Audit Field Data Into Better Building Performance Decisions With BPMS™
Published 9/9/2026
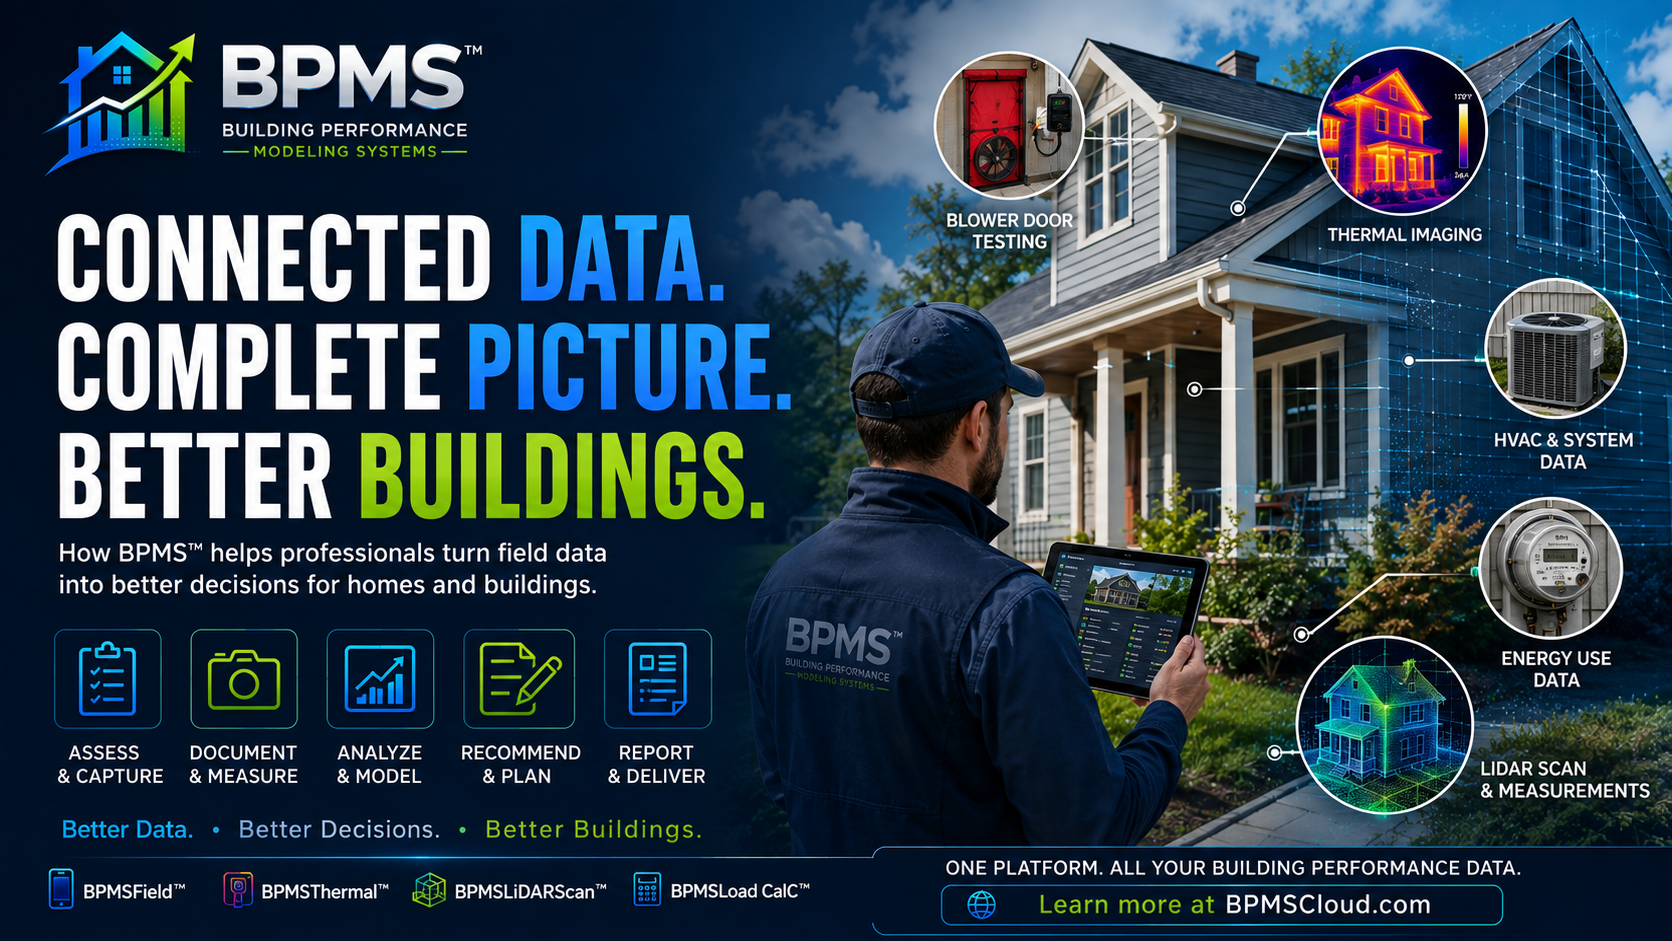
A professional energy audit can generate blower-door measurements, thermal images, HVAC information, building geometry, energy-use history, photographs, envelope observations, and more. Learn how a connected building-performance workflow can transform those individual data points into organized analysis, practical recommendations, WorkScopes, and professional project documentation.
How to Turn Energy Audit Field Data Into Better Building Performance Decisions With BPMS™
A comprehensive energy audit can produce an enormous amount of information.
An auditor may document the building envelope, measure air leakage, inspect insulation, evaluate heating and cooling equipment, photograph existing conditions, collect utility information, perform diagnostic testing, record dimensions, identify potential retrofit opportunities, and gather information needed for energy modeling or program documentation.
Collecting this information is important.
But collecting data is not the ultimate objective.
The real objective is to transform reliable field information into a clear understanding of the building and then use that understanding to make better-informed decisions.
That requires a workflow capable of moving from:
Assessment → Documentation → Analysis → Recommendations → WorkScope → Delivery
A connected building-performance platform can help professionals maintain that continuity from the first field observation through the final project documentation.
Why Building-Performance Data Becomes Fragmented
Building performance is inherently multidisciplinary.
A single assessment can involve information about:
* Building geometry and orientation
* Walls, attics, foundations, floors, windows, and doors
* Insulation type and condition
* Observable air-leakage opportunities
* Blower-door measurements
* Duct-system characteristics and leakage testing
* Heating and cooling equipment
* Domestic hot-water systems
* Combustion-related observations and testing when applicable
* Thermostat and control strategies
* Appliances and lighting
* Utility consumption
* Thermal photographs
* Standard field photographs
* LiDAR or dimensional measurements
* Health, safety, and indoor-environment observations
* Potential energy-conservation measures
* Electrification opportunities
* Solar or renewable-energy considerations
Each category contributes another piece of information about the building.
Problems arise when those pieces are stored in separate applications, notebooks, camera rolls, spreadsheets, PDFs, email threads, and calculation tools.
The professional may have all the information needed to understand the project, but reconstructing the relationship between those pieces can become unnecessarily difficult.
The Difference Between Collecting Data and Creating Useful Information
A blower-door result is data.
A thermal image is data.
A utility bill is data.
The dimensions of an attic are data.
The efficiency rating of a heating system is data.
Individually, each can be useful. Their greater value emerges when they are evaluated in context.
Consider a house with high heating consumption.
That observation alone does not establish why the building uses more energy than expected.
A broader assessment might identify several contributing conditions:
* Elevated measured air leakage
* Inconsistent attic insulation
* Thermal patterns requiring further investigation
* Ductwork outside conditioned space
* Older heating equipment
* Significant exposed envelope area
Now the auditor has something more useful than isolated measurements.
The professional has a building-performance picture.
This is one reason whole-building analysis remains so important: energy performance frequently results from interactions among the enclosure, mechanical systems, occupants, climate, controls, and operating conditions.
Step 1: Assess the Building as a System
A strong workflow begins before calculations or recommendations.
It begins with understanding the building.
The assessment should capture the information appropriate to the project’s purpose, program requirements, applicable standards, climate, building type, and professional scope.
That might include basic construction characteristics, conditioned floor area, number of stories, envelope assemblies, HVAC equipment, domestic hot water, utility information, and observable existing conditions.
More comprehensive assessments may incorporate diagnostic testing and modeling.
The key is not to perform every possible test on every project.
The key is to collect the information necessary to answer the questions the assessment is intended to address.
Step 2: Document Conditions in the Field
Field documentation provides the evidence behind later analysis.
Photographs can document equipment, insulation, deterioration, penetrations, inaccessible conditions, nameplates, and retrofit opportunities.
Measurements provide quantitative information.
Notes preserve observations that may not be apparent from photographs.
Modern mobile tools can help keep this information associated with the correct project rather than requiring it to be reconstructed later.
BPMSField™, for example, is designed to extend the BPMS™ project workflow into the field so project documentation can be associated with the relevant building assessment.
The objective is straightforward:
Capture information once and keep it connected to the project where it will ultimately be used.
Step 3: Add Diagnostic Measurements
Visual inspection is important, but building-performance professionals often need measurements to understand conditions that cannot be reliably evaluated by sight alone.
Blower-Door Testing
A blower-door test can quantify whole-building air leakage under a controlled pressure difference.
Results such as CFM50 can be used with building volume to calculate ACH50:
ACH50 = (CFM50 × 60) ÷ Building Volume
The result provides a standardized measure of enclosure leakage at 50 Pascals.
Its interpretation should consider the applicable program, code, standard, climate, building characteristics, and purpose of the test.
Duct Leakage Testing
Duct leakage testing can quantify leakage from an HVAC distribution system under prescribed test conditions.
Where appropriate, results can be normalized to conditioned floor area or evaluated against applicable program or code criteria.
Rather than treating blower-door and duct-leakage results as unrelated reports, a connected project record allows those measurements to remain associated with the building, HVAC system, recommendations, and eventual retrofit scope.
Step 4: Use Thermal Imaging as Context, Not a Diagnosis
Infrared thermography can add another valuable layer of information.
Thermal imaging visualizes apparent surface-temperature patterns. Under suitable conditions, those patterns can help trained professionals identify areas requiring additional investigation.
Examples can include patterns potentially associated with:
* Insulation irregularities
* Air movement
* Thermal bridging
* HVAC distribution
* Moisture-related conditions requiring verification
* Differences in building-envelope performance
A thermal image alone generally should not be treated as definitive proof of the underlying cause of a temperature difference.
Interpretation depends on factors including indoor-outdoor temperature difference, solar exposure, wind, surface emissivity, weather history, HVAC operation, and building construction.
This is why thermal imaging becomes particularly valuable when combined with other evidence.
BPMS Thermal™ can support thermal field documentation as part of the broader project record rather than leaving infrared images disconnected from the audit.
Step 5: Capture Building Geometry More Efficiently
Geometry influences many building-performance calculations.
Professionals may need wall areas, window areas, room dimensions, floor areas, ceiling dimensions, volumes, and other measurements.
Traditional field measurements remain appropriate in many situations, but modern depth-sensing and LiDAR-capable devices can provide another method for documenting spaces and geometry.
BPMS LiDARScan™ is intended to bring this type of dimensional information into the BPMS™ field workflow.
LiDAR does not eliminate the need to verify important measurements, particularly where calculations, compliance, design, or construction depend on dimensional accuracy.
Its value is in helping professionals collect and organize spatial information more efficiently.
Step 6: Connect HVAC Performance to the Building Envelope
One of the most important principles in building science is that HVAC equipment should not be evaluated in isolation from the building it serves.
Heating and cooling demand is influenced by factors such as:
* Outdoor design conditions
* Indoor design conditions
* Envelope area
* Insulation
* Window performance
* Solar gains
* Air leakage
* Internal gains
* Duct location and performance
This is why envelope improvements can influence HVAC decisions.
Air sealing, insulation, window changes, additions, and other building modifications may alter heating or cooling loads.
When equipment sizing is required, recognized procedures and applicable professional requirements should be followed.
BPMS Load CalC™ is part of the BPMS™ ecosystem intended to connect load-analysis workflows with other building and project information.
Step 7: Evaluate Energy Use in Context
Utility consumption can provide another important perspective.
Historical electricity, natural gas, fuel oil, propane, or other energy consumption can help establish how the building has actually been operating.
But utility data also requires interpretation.
Consumption can be influenced by:
* Weather
* Occupancy
* Thermostat settings
* Equipment efficiency
* Domestic hot-water use
* Plug loads
* Lighting
* Building-envelope performance
* Vacancies or changes in occupancy
* Behavioral patterns
Historical consumption therefore should not automatically be attributed to a single building condition.
It becomes most useful when considered alongside the physical assessment.
Step 8: Convert Findings Into Recommendations
An energy audit becomes actionable when observations and analysis are translated into appropriate recommendations.
Potential measures may include:
* Air sealing
* Attic, wall, floor, or foundation insulation
* Duct sealing or insulation
* HVAC improvements
* Heat-pump installation
* Heating-system upgrades
* Domestic hot-water improvements
* Lighting improvements
* Controls
* Electrical upgrades
* Ventilation improvements
* Window or door improvements where justified
* Solar photovoltaic systems
* Electrification measures
Recommendations should reflect the actual building and the objectives of the project.
They also should account for interactions.
For example, significant enclosure improvements may affect heating and cooling loads. Air sealing may require consideration of ventilation and combustion-related implications where applicable. Electrification projects may require evaluation of electrical capacity.
Building performance is a system.
Retrofit planning should treat it that way.
Step 9: Move From Recommendations to a WorkScope
A recommendation identifies what should be considered.
A professional WorkScope goes further.
It defines what work is expected.
Depending on the project, a WorkScope may document:
* Existing condition
* Recommended measure
* Location
* Quantity
* Material or equipment requirements
* Installation requirements
* Performance objectives
* Testing requirements
* Photographic documentation
* Contractor responsibilities
* Applicable program requirements
* Completion or verification criteria
This is where organized field information becomes particularly valuable.
Instead of recreating the project from scattered notes, the professional can use the assessment record to develop a clearer scope of work.
Within BPMS™, the broader objective is to connect the progression from audit findings to recommendations, WorkScopes, proposals, and project documentation.
Step 10: Preserve the Chain From Evidence to Decision
A useful building-performance workflow should make it possible to understand not only what was recommended, but why.
For example:
Field observation
Insulation appears inconsistent in portions of the attic.
↓
Supporting documentation
Field photographs and thermal patterns identify areas requiring investigation.
↓
Measurement
Attic area and existing insulation conditions are documented.
↓
Analysis
The professional evaluates the condition in the context of climate, existing assembly, project objectives, and applicable requirements.
↓
Recommendation
Improve attic air sealing and insulation where appropriate.
↓
WorkScope
Define preparation, air-sealing locations, insulation requirements, installation expectations, quantities, and verification.
That chain creates traceability.
It also makes the final recommendation easier to communicate to property owners, contractors, program administrators, and other project participants.
Where BPMS™ Fits Into the Workflow
BPMS™ — Building Performance Modeling Systems™ is being developed around a simple principle:
Building-performance information becomes more useful when it remains connected.
Different BPMS™ tools can support different portions of that process.
BPMSField™ supports field-oriented project documentation.
BPMS Thermal™ supports thermal-imaging workflows.
BPMS LiDARScan™ supports spatial and dimensional field information.
BPMS Load CalC™ supports heating and cooling load-analysis workflows.
Additional BPMS™ functionality can organize audit information, building characteristics, photographs, diagnostic results, recommendations, WorkScopes, proposals, and reporting within the broader project environment.
The goal is not to replace professional judgment.
It is to give qualified professionals a better-organized information environment in which to exercise that judgment.
Better Data Does Not Mean More Data
One of the easiest mistakes in modern building diagnostics is assuming that more sensors, photographs, measurements, and software automatically create a better assessment.
They do not.
Useful data should be:
Relevant. Accurate. Understandable. Connected. Actionable.
A hundred disconnected measurements can be less useful than ten well-chosen measurements that answer the project’s important questions.
Technology should therefore reduce fragmentation—not create another layer of it.
The Future of Building-Performance Assessment Is Connected
Building-performance professionals increasingly have access to sophisticated tools.
Thermal cameras can visualize temperature patterns.
Blower doors quantify enclosure leakage.
Duct-testing equipment measures distribution-system leakage.
LiDAR can help document geometry.
Energy models can evaluate performance scenarios.
Smart devices can produce increasingly detailed operational information.
The next challenge is connecting those capabilities into workflows that professionals can actually use.
The strongest building-performance process is not simply:
Collect more data.
It is:
ASSESS → DOCUMENT → MEASURE → ANALYZE → RECOMMEND → DELIVER → VERIFY
When information remains connected throughout that process, professionals can spend less time reconstructing project data and more time understanding what the building is telling them.
Build a More Connected Building-Performance Workflow
BPMS™ is designed to bring field documentation, building information, diagnostics, analysis, recommendations, and project deliverables into a more connected workflow for building-performance professionals.
Whether you’re performing energy audits, HVAC assessments, weatherization projects, Home Energy Score work, diagnostic testing, thermal investigations, retrofit planning, or other building-performance services, the objective remains the same:
Better Data. Better Decisions. Better Buildings.
Explore BPMS™ — Building Performance Modeling Systems™ at BPMSCloud.com.
Comments and Reviews
Share what you found helpful and how this article supported your work.
0.0/5from 0 reviews
No reviews yet. Be the first to share your feedback.