
Connected Building Performance: How Better Field Data Leads to Better Energy Decisions
Published 9/14/2026
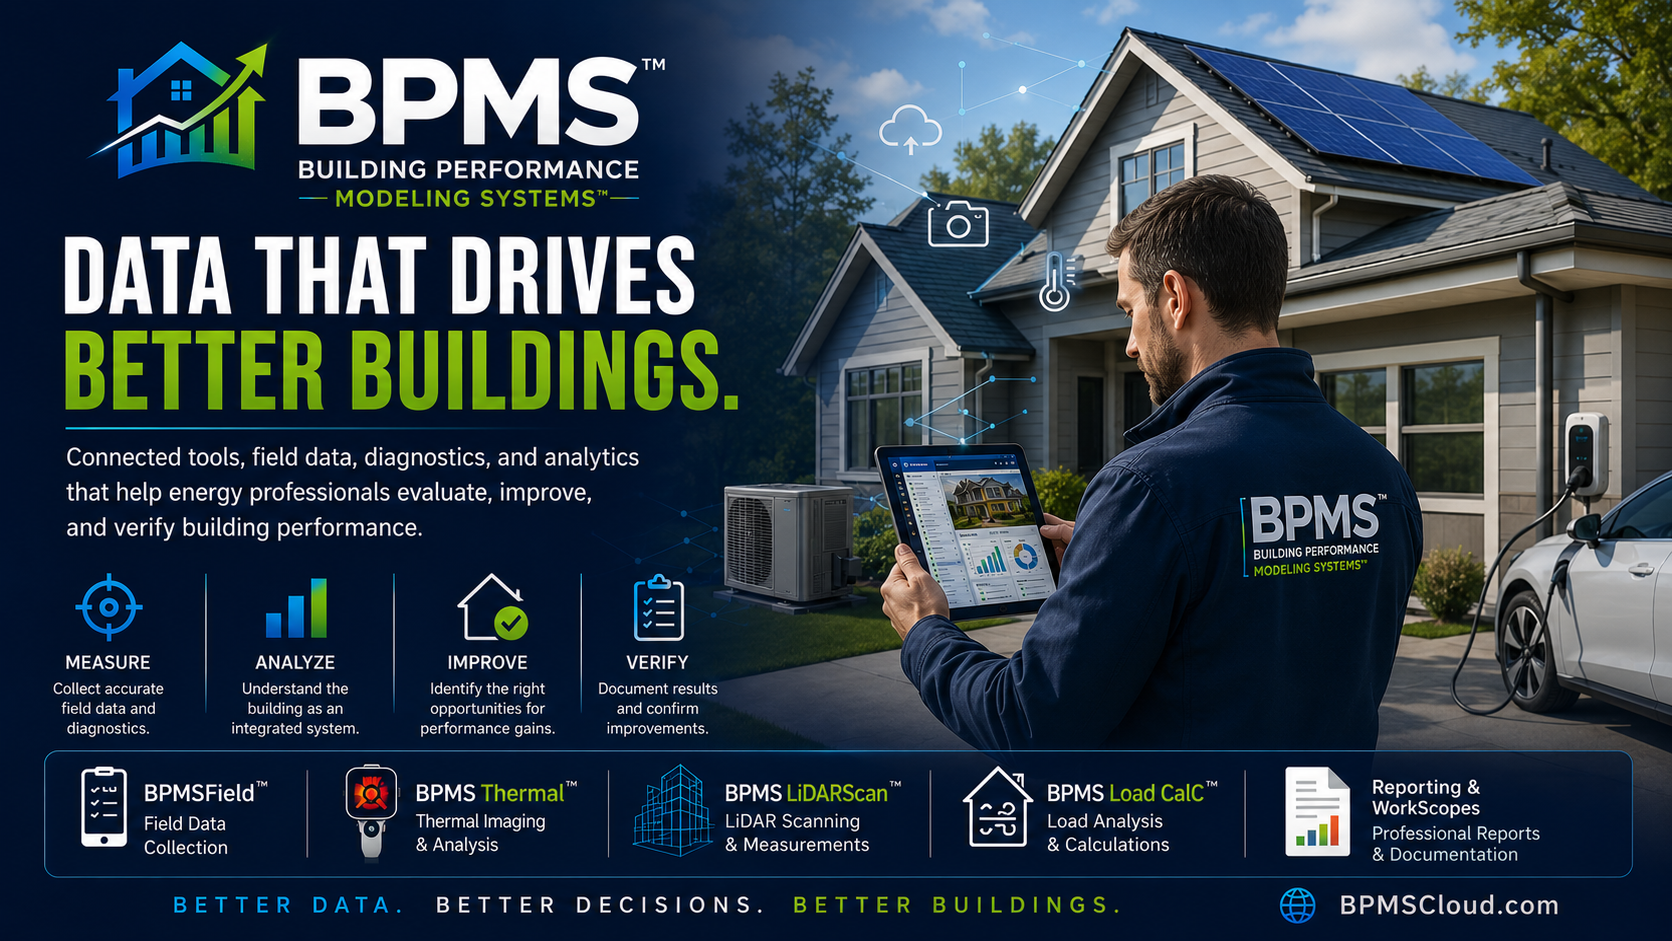
Building-performance professionals collect information from energy audits, diagnostic testing, thermal imaging, HVAC systems, utility history, building geometry, and field observations. Learn how connecting that information can improve analysis, retrofit planning, project documentation, and verification while reducing fragmented workflows.
Connected Building Performance: How Better Field Data Leads to Better Energy Decisions
Modern building-performance work can generate an extraordinary amount of information.
An energy auditor may begin with building dimensions and utility history, document insulation and envelope conditions, perform blower-door testing, evaluate HVAC equipment, capture photographs, collect thermal images, inspect duct systems, identify potential health and safety concerns, and develop recommendations for improving the property.
An HVAC contractor may approach the same building from a different direction, concentrating on heating and cooling loads, equipment condition, air distribution, controls, ventilation, electrification, or replacement options.
A weatherization professional may focus heavily on enclosure improvements, diagnostic testing, installation specifications, and post-work verification.
A solar contractor may need yet another set of information about electricity consumption, roof characteristics, future electrification loads, and photovoltaic opportunities.
These activities may look different, but they share an important requirement:
Good decisions depend on good information—and good information becomes substantially more useful when it remains connected to the building and the decisions it supports.
That idea is at the center of connected building performance.
⸻
What Is Connected Building Performance?
Connected building performance is not simply putting information into software.
It is the practice of maintaining meaningful relationships among:
* Building characteristics
* Field observations
* Measurements
* Diagnostic results
* Energy consumption
* HVAC information
* Photographs
* Thermal documentation
* Building geometry
* Calculations
* Recommendations
* WorkScopes
* Proposals
* Installation information
* Verification results
Consider a blower-door measurement of 1,650 CFM50.
By itself, that is a useful test result.
But its value increases when it remains associated with the building volume used to calculate ACH50, the conditions under which the test was conducted, photographs of suspected leakage locations, thermal observations, proposed air-sealing measures, and a post-retrofit blower-door result.
The objective is not merely to store more data.
It is to preserve context.
⸻
The Problem With Fragmented Building Data
Building-performance professionals often use multiple tools because the work itself spans multiple disciplines.
A typical project might involve:
* A mobile phone for photographs
* Paper or digital inspection forms
* A blower-door manometer
* Thermal-imaging equipment
* A spreadsheet for utility analysis
* Separate HVAC calculation software
* LiDAR or measuring equipment
* PDF reports
* Email
* Proposal software
* Accounting software
* Program-specific portals
Each tool may perform its individual job well.
The difficulty occurs between those tools.
A technician may return from the field with 75 photographs, handwritten notes, a blower-door result, equipment nameplate photographs, thermal images, utility bills, room measurements, and recommendations.
Someone then has to reconstruct the project.
Which thermal image corresponds to which wall?
Was the CFM50 measurement from the pre-work or post-work test?
Which HVAC system serves the addition?
Was the attic area measured or estimated?
Which recommendation resulted from which observation?
Which photograph belongs in the final report?
Fragmentation introduces administrative work precisely where professionals should be concentrating on analysis.
⸻
Start With the Building, Not the Software
A connected workflow should begin with the physical building.
Software does not determine what information is important.
The building and the purpose of the assessment do.
A residential energy audit may require information about:
Building Geometry
Conditioned floor area, building volume, number of stories, orientation, room dimensions, and envelope areas can affect numerous calculations.
Building Envelope
Walls, attics, roofs, foundations, floors, windows, doors, insulation, air barriers, and transitions influence heat transfer and air movement.
Mechanical Systems
Heating, cooling, ventilation, domestic hot water, controls, and distribution systems influence energy use and indoor conditions.
Occupancy and Operation
Thermostat settings, schedules, appliance use, domestic hot-water consumption, and other operating characteristics can significantly affect actual energy consumption.
Climate
Heating and cooling requirements depend heavily on outdoor conditions.
A useful building-performance system should help organize these inputs without confusing the software record with the building itself.
⸻
Field Data Is the Foundation
Most building-performance analysis ultimately depends on what happened in the field.
An auditor might document:
* Existing insulation
* Air-sealing opportunities
* Window characteristics
* Heating-system information
* Cooling equipment
* Duct locations
* Ventilation equipment
* Domestic hot-water systems
* Electrical service
* Solar exposure
* Combustion appliances
* Moisture observations
* Building dimensions
* Health and safety conditions
This information needs to be captured accurately enough for the intended purpose.
That is where mobile field workflows can become valuable.
BPMSField™ is designed to extend BPMS™ project documentation into the field so photographs and other project information can remain associated with the appropriate assessment rather than being reconstructed later from a camera roll or unrelated folder.
The principle is simple:
Capture information where it originates and preserve its relationship to the project.
⸻
Diagnostic Testing Adds Measurable Evidence
Visual observations are important, but many aspects of building performance cannot be evaluated reliably by sight alone.
Diagnostic testing converts some of those invisible conditions into measurements.
Blower-Door Testing
Blower-door testing measures the airflow required to maintain a controlled indoor-outdoor pressure difference.
A commonly reported result is:
CFM50 — cubic feet per minute at 50 Pascals
When building volume is known, CFM50 can be converted to ACH50:
ACH50 = (CFM50 × 60) ÷ Building Volume
ACH50 normalizes the measured leakage to building volume.
Neither CFM50 nor ACH50 represents the building’s ordinary natural infiltration rate. They describe enclosure leakage under the specified test condition.
When the result remains connected with the rest of the assessment, the professional can evaluate it alongside enclosure construction, thermal observations, ventilation considerations, and proposed air-sealing measures.
⸻
Duct Leakage Is a Different Measurement
Building-envelope leakage and duct-system leakage are related to building performance, but they are not the same thing.
Duct leakage testing evaluates leakage from the HVAC distribution system under a prescribed pressure condition.
Depending on the applicable test procedure, program, or code, results may be expressed as CFM25 or normalized to floor area.
A common normalization is:
CFM25 per 100 ft² = (Measured CFM25 × 100) ÷ Conditioned Floor Area
Applicable test procedures, allowable leakage levels, and compliance requirements vary by code edition, jurisdiction, construction stage, and program.
Keeping duct results associated with the HVAC system helps preserve that distinction.
⸻
Thermal Imaging Adds Visual Context
Infrared thermography can reveal apparent surface-temperature patterns that are difficult or impossible to see with ordinary vision.
Under appropriate conditions, those patterns may help a trained professional investigate:
* Insulation irregularities
* Potential air-movement pathways
* Thermal bridging
* HVAC distribution conditions
* Areas requiring further moisture investigation
* Envelope performance differences
But thermal imaging is not a universal diagnostic answer.
Surface temperature can be influenced by solar loading, wind, emissivity, reflections, indoor-outdoor temperature difference, weather history, HVAC operation, material characteristics, and moisture.
A thermal pattern therefore should not automatically be labeled as missing insulation or air leakage without supporting evidence.
This is precisely where connected data becomes useful.
A thermal image interpreted alongside blower-door operation, construction details, photographs, and field observations provides substantially more context than the same image viewed alone.
BPMS Thermal™ can support thermal documentation within the broader BPMS™ project workflow.
⸻
Building Geometry Connects to Multiple Calculations
Geometry is another example of information that should not need to be repeatedly collected.
Wall area may influence envelope analysis.
Building volume is needed for ACH50.
Room dimensions influence HVAC load calculations.
Roof geometry may influence solar analysis.
Floor area may be required for program reporting or normalized diagnostic metrics.
Modern LiDAR-capable devices can help professionals collect dimensional information efficiently.
BPMS LiDARScan™ is intended to support spatial documentation and building measurements within the BPMS™ field environment.
Important dimensions should still be verified when required for design, construction, compliance, or other accuracy-sensitive applications.
The larger opportunity is to allow one reliable piece of building information to support multiple appropriate workflows.
⸻
Utility Data Shows How the Building Has Been Operating
Diagnostic testing describes specific conditions.
Utility history provides another perspective: actual energy consumption.
Electricity, natural gas, fuel oil, propane, and other energy use may be influenced by:
* Weather
* Occupancy
* Thermostat settings
* HVAC efficiency
* Envelope performance
* Domestic hot-water use
* Lighting
* Appliances
* Plug loads
* Solar generation
* Electric vehicles
* Operating schedules
Utility consumption therefore should not automatically be attributed to a single condition.
A high electricity bill does not prove poor insulation.
A high heating bill does not prove excessive air leakage.
The value comes from evaluating consumption alongside the physical building.
⸻
HVAC Loads Depend on the Building
HVAC equipment serves a load created by the building and its operating conditions.
That load can be influenced by:
* Outdoor design conditions
* Indoor design conditions
* Envelope areas
* Insulation
* Window performance
* Solar gains
* Air leakage
* Ventilation
* Internal gains
* Duct characteristics
This is why equipment sizing based only on square footage or the capacity of the existing system can be problematic.
Residential load calculations using applicable professional methodologies help establish the heating and cooling requirements that should inform equipment selection.
BPMS Load CalC™ is intended to connect load-analysis workflows with the broader building record.
Where formal Manual J, equipment-selection, code, program, or permitting requirements apply, professionals should use the required approved methods and software and follow the applicable procedures.
⸻
Energy-Efficiency Improvements Change the Building
A building is not static during a retrofit.
Suppose an existing house receives:
* Attic air sealing
* Additional insulation
* Reduced enclosure leakage
* Improved windows
* Duct sealing
The post-retrofit building is thermally different from the pre-retrofit building.
Its heating and cooling loads may change.
Its ventilation requirements may need to be considered.
Its HVAC operating characteristics may change.
This demonstrates why retrofit measures should not always be treated as unrelated line items.
The building operates as a system.
⸻
Electrification Makes Connected Analysis Even More Important
Electrification can connect several previously separate building decisions.
Consider a project involving:
* A new heat pump
* Heat-pump water heating
* Induction cooking
* Electric-vehicle charging
* Solar photovoltaics
* Battery storage
Each measure may influence electrical demand or consumption.
The HVAC load influences heat-pump selection.
The heat pump affects electricity use.
Future EV charging affects electrical demand.
Solar generation interacts with annual electricity consumption.
The existing electrical service may influence project feasibility.
Evaluating these elements together can produce a more realistic electrification strategy than treating each technology independently.
Electrical work must, of course, comply with applicable codes, permitting requirements, equipment instructions, utility requirements, and qualified-professional practices.
⸻
Solar Analysis Benefits From Understanding Future Loads
Solar contractors frequently begin with historical electricity consumption.
That remains valuable, but historical consumption may not represent future consumption.
A home planning to replace fossil-fuel heating with a heat pump may use substantially more electricity.
Adding EV charging can increase consumption further.
Efficiency improvements may reduce other loads.
A useful solar analysis should therefore distinguish between:
Historical energy use and anticipated future energy use.
That is another reason integrated building information can be valuable.
The building-performance assessment can help inform the assumptions behind future energy scenarios.
⸻
From Findings to Recommendations
Data becomes useful when it informs decisions.
A comprehensive assessment may identify opportunities such as:
* Air sealing
* Insulation
* Duct sealing
* HVAC replacement
* Heat-pump conversion
* Ventilation improvements
* Domestic hot-water upgrades
* Lighting improvements
* Appliance replacement
* Electrical upgrades
* Controls
* Solar photovoltaics
* EV charging preparation
The appropriate recommendation depends on the building, project goals, budget, climate, applicable programs, and professional judgment.
Not every technically possible measure is appropriate for every building.
⸻
Recommendations Should Become Clear WorkScopes
A recommendation such as:
“Improve attic insulation”
may be appropriate at the audit stage, but it is not necessarily sufficient for installation.
A useful WorkScope may need to identify:
* Existing condition
* Work location
* Area or quantity
* Preparation requirements
* Air-sealing requirements
* Material or equipment specifications
* Installation expectations
* Performance objective
* Testing or verification requirements
* Documentation requirements
Connected project information makes this transition easier because the scope can be developed from the same evidence that produced the recommendation.
BPMS™ is designed to support the progression from project information and findings toward recommendations, WorkScopes, proposals, and reporting.
⸻
Verification Closes the Performance Loop
One of the most important stages in building performance is often the last:
Did the improvement accomplish what was intended?
Verification can take many forms.
After air sealing, a blower-door retest may quantify enclosure leakage reduction.
After duct sealing, duct leakage testing may document improvement.
After insulation work, visual inspection and appropriate documentation may confirm installation.
HVAC commissioning can help evaluate system operation.
Utility data collected over time may provide insight into actual energy performance, although weather, occupancy, and operational differences need to be considered.
The ideal workflow therefore does not stop at recommendations.
It follows:
MEASURE → ANALYZE → IMPROVE → VERIFY
⸻
Why Data Quality Matters More Than Data Quantity
Modern buildings can generate enormous amounts of information.
More data is not automatically better.
For professional building-performance work, useful information should be:
Relevant
It should answer a meaningful project question.
Reliable
The measurement or observation should be appropriate for its intended use.
Traceable
Professionals should be able to understand where the information came from.
Contextual
A number without the conditions surrounding it can easily be misunderstood.
Actionable
The information should help support a decision, recommendation, or verification process.
The objective should therefore be better data—not simply more data.
⸻
Where BPMS™ Fits
BPMS™ — Building Performance Modeling Systems™ is being developed around the concept of connected building-performance information.
The broader ecosystem includes workflows such as:
BPMSField™ for field-oriented project documentation.
BPMS Thermal™ for thermal-imaging documentation and analysis workflows.
BPMS LiDARScan™ for spatial and dimensional field information.
BPMS Load CalC™ for heating and cooling load-analysis workflows.
Additional BPMS™ functionality can help organize building characteristics, diagnostic results, photographs, recommendations, WorkScopes, proposals, invoices, and professional reports.
The goal is not to automate professional judgment out of building performance.
It is to give professionals a better-organized environment in which to exercise that judgment.
⸻
The Future of Building Performance Is Connected
Energy efficiency is increasingly intersecting with HVAC, electrification, renewable energy, grid interaction, indoor environmental quality, and decarbonization.
A building may simultaneously be:
* Reducing enclosure leakage
* Adding insulation
* Replacing fossil-fuel heating
* Installing a heat pump
* Adding solar photovoltaics
* Preparing for EV charging
* Upgrading electrical service
* Improving ventilation
Those decisions interact.
The software supporting those professionals should increasingly recognize those relationships.
The future of building performance is therefore unlikely to be a collection of completely isolated calculations.
It is a connected process:
OBSERVE → MEASURE → ANALYZE → MODEL → RECOMMEND → IMPLEMENT → VERIFY
Technology can help organize that process.
Qualified professionals still determine what the information means and what should be done with it.
⸻
Build a More Connected Building-Performance Workflow
Every measurement tells part of the story.
A blower-door result describes enclosure leakage under a test condition.
A thermal image provides surface-temperature information.
LiDAR can help document geometry.
Utility history shows how the building has consumed energy.
HVAC calculations help quantify heating and cooling requirements.
Photographs preserve field evidence.
Recommendations translate findings into opportunities.
Verification determines whether improvements achieved their intended measurable results.
The greatest value emerges when those pieces can be evaluated together.
That is the principle behind BPMS™.
Better Data. Better Decisions. Better Buildings.
Explore BPMS™ — Building Performance Modeling Systems™ at BPMSCloud.com.
Comments and Reviews
Share what you found helpful and how this article supported your work.
0.0/5from 0 reviews
No reviews yet. Be the first to share your feedback.